Eclipse Tutorial for ITC129
From PeacockWiki
| Revision as of 09:31, 7 November 2005 (edit) Trevorp (Talk | contribs) (→Debugging an Application - add images) ← Previous diff |
Current revision (09:43, 7 November 2005) (edit) Trevorp (Talk | contribs) (→Installation - fix image) |
||
| Line 46: | Line 46: | ||
| Now its time for a quick introduction to the Eclipse "Java Perspective". | Now its time for a quick introduction to the Eclipse "Java Perspective". | ||
| - | Along the top we see the normal type menus, followed by a toolbar. The First icon is the "new" ([[Image:Eclipse2.1-New.jpg]) icon, it can be used to create new projects and classes (rather than going File->New). Next is the "Save" icon which simply saves the current class. It may also be useful to save all classes you are working on. To do this go File -> Save All, or use the shortcut key Ctrl + Shift + S. A little further along is the normal print icon, followed by the two more important icons. The first being the "Debug" icon (the little bug icon) and the "Run" icon ([[Image:Eclipse2.1-DebugRun.jpg]]), which we will use shortly. Also further on are some forward and backward icons. These can be used to jump back and forward through an open file, to the last part you edited. Experiment with these later, it can make working on a large file (like the ones in the assignment) easier and quicker. Further on are some up and down arrows which can be used for jumping to errors in your files. | + | Along the top we see the normal type menus, followed by a toolbar. The First icon is the "new" ([[Image:Eclipse2.1-New.jpg]]) icon, it can be used to create new projects and classes (rather than going File->New). Next is the "Save" icon which simply saves the current class. It may also be useful to save all classes you are working on. To do this go File -> Save All, or use the shortcut key Ctrl + Shift + S. A little further along is the normal print icon, followed by the two more important icons. The first being the "Debug" icon (the little bug icon) and the "Run" icon ([[Image:Eclipse2.1-DebugRun.jpg]]), which we will use shortly. Also further on are some forward and backward icons. These can be used to jump back and forward through an open file, to the last part you edited. Experiment with these later, it can make working on a large file (like the ones in the assignment) easier and quicker. Further on are some up and down arrows which can be used for jumping to errors in your files. |
| Down the left side is are the different "Perspectives". We can use this later to switch between the "Java Perspective" and the "Debug Perspective". | Down the left side is are the different "Perspectives". We can use this later to switch between the "Java Perspective" and the "Debug Perspective". | ||
| Line 96: | Line 96: | ||
| Click Finish. | Click Finish. | ||
| - | That's all there is to importing. You can drop down the contents of your project in the "Package Explorer" on the left (clicking the little beside the project, then drop down the "(default package) to see your files. You can double click on the file to edit it. | + | That's all there is to importing. You can drop down the contents of your project in the "Package Explorer" on the left (clicking the little [[Image:Tree-Plus.jpg]] beside the project, then drop down the "(default package) to see your files. You can double click on the file to edit it. |
| Exporting follows much the same process. File -> Export, select "File System" click next. Select the project on the left, then the files you want to export (you dont need to export ".classpath" or ".project" files. Select the destination in the "To directory" field, then select finish. | Exporting follows much the same process. File -> Export, select "File System" click next. Select the project on the left, then the files you want to export (you dont need to export ".classpath" or ".project" files. Select the destination in the "To directory" field, then select finish. | ||
| Line 173: | Line 173: | ||
| Breakpoints can also be Enabled and disabled, so that the breakpoints remain in place, but do not stop the program. You can do this by right clicking on the breakpoint dot beside your source code, or by right clicking the breakpoint in the breakpoints view. | Breakpoints can also be Enabled and disabled, so that the breakpoints remain in place, but do not stop the program. You can do this by right clicking on the breakpoint dot beside your source code, or by right clicking the breakpoint in the breakpoints view. | ||
| - | Java allows you to run your program multiple times simultaneously (by hitting the run or debug button, then hitting it again). This can become a little confusing, and can also cause problems because you have multiple copies of your program running taking up processor time and computer memory. If you do end up with this situation, you can right click in the "Debug" view, and choose "Terminate All". This will stop all current instances of your program. You can also use the minus button () or right click and select "Remove All Terminated" to clear up the debug box. | + | Java allows you to run your program multiple times simultaneously (by hitting the run or debug button, then hitting it again). This can become a little confusing, and can also cause problems because you have multiple copies of your program running taking up processor time and computer memory. If you do end up with this situation, you can right click in the "Debug" view, and choose "Terminate All". This will stop all current instances of your program. You can also use the minus button ([[Image:Eclipse2.1-DebugRemoveTerminated.jpg]]) or right click and select "Remove All Terminated" to clear up the debug box. |
| + | |||
| + | [[Image:Eclipse_Tutorial_for_ITC129-Screen16.jpg]] | ||
| You can stop your program at any time by pressing the stop button either in the debug view or in the console (output) view. | You can stop your program at any time by pressing the stop button either in the debug view or in the console (output) view. | ||
| Line 180: | Line 182: | ||
| - | All queries and comments are welcome. If you have any problems or queries about this tutorial, please email trevorp-itc129@peacocktech.com | + | All queries and comments are welcome. If you have any problems or queries about this tutorial, please email [mailto:trevorp-itc129@peacocktech.com trevorp-itc129@peacocktech.com] |
| Your input is what drives this site. | Your input is what drives this site. | ||
| <div id="reference">Special thanks to Reann for her valuable assistance in compiling this tutorial.</div> | <div id="reference">Special thanks to Reann for her valuable assistance in compiling this tutorial.</div> | ||
Current revision
This article is in the process of being moved. Until it is completed, the original article may be found at http://java.peacocktech.com/eclipsetutorial/index.jsp
Eclipse an IDE (Integrated Development Environment) that supports the development of java programs, providing features that make programming java programs easier and more time efficient. Eclipse is designed to support the needs of a professional programmer, and thus has many features that ITC129 students do not require. With all these additional features finding the features that you actually do need can be a little difficult. This tutorial addresses these difficulties and introduces features useful to a Java student.
Contents |
Installation
Here are a few links from the official Eclipse site:
Official Site - http://www.eclipse.org/
Download Page - http://www.eclipse.org/downloads/index.php
Direct Download Links - http://eclipse.planetmirror.com/downloads/drops/R-2.1-200303272130/eclipse-SDK-2.1-win32.zip http://mirror.pacific.net.au/eclipse/eclipse/downloads/drops/R-2.1-200303272130/eclipse-SDK-2.1-win32.zip
Be warned, the download is about a 70Mb download, so if you know someone who has it already, it could save you the download.
There is a newer version, but the links above are the version used in this tutorial (version 2.1) although the newer one (2.1.1) should be virtually identical.
There are also versions of eclipse for Linux and Mac OS.
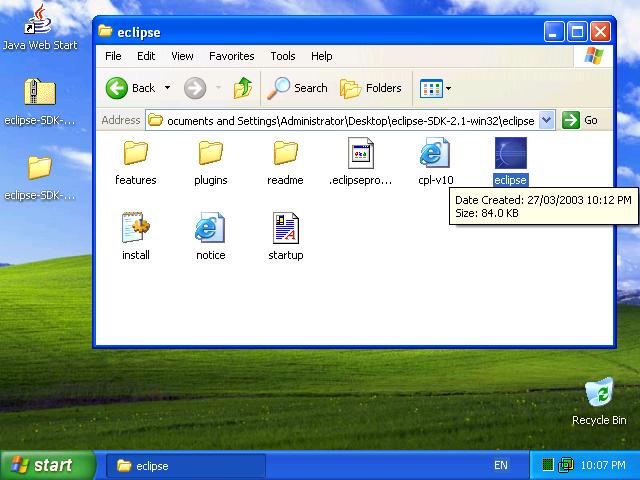
The download is a zip file. Unzip the file using your favourite zip program, then the folder, find eclipse.exe and run it. Eclipse does not need to be installed, it will run directly from the unzipped folder.
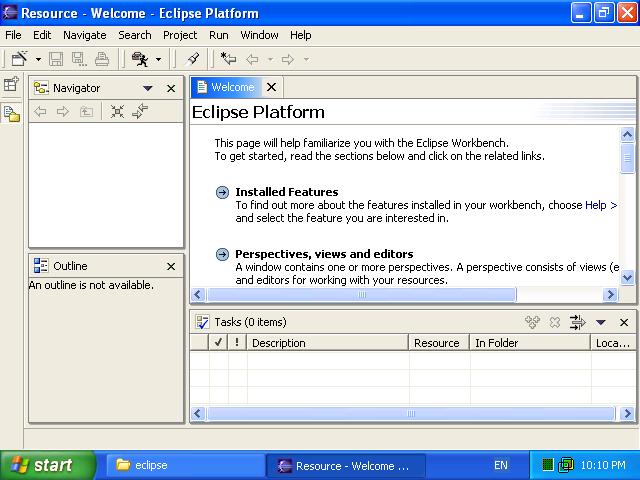
Eclipse may take a little minute to start, but upon running eclipse you should see something that looks like this.
You can close the welcome screen by hitting the "X" on the Welcome tab.
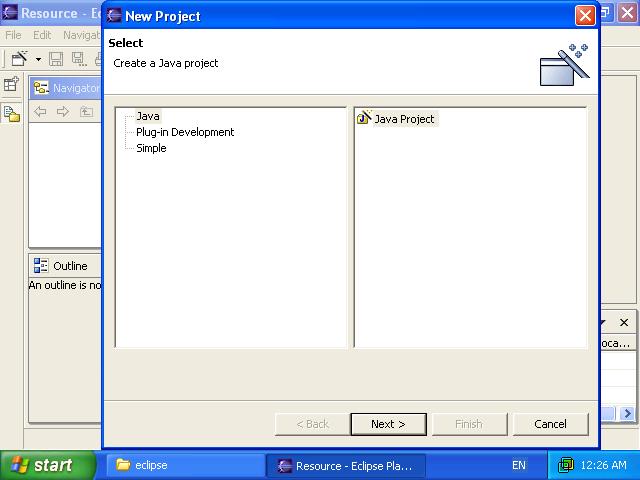
To begin using Eclipse go File -> New -> Project. Click next to create a Java Project. Give the project a name, then click Finish.
Eclipse may ask you "This kind of project is associated with the Java Perspective. Do you want to switch to this kind of perspective now?" Answer "Yes" to this question and Eclipse will arrange the display for Java editing. You may also check "Do not show this message again".
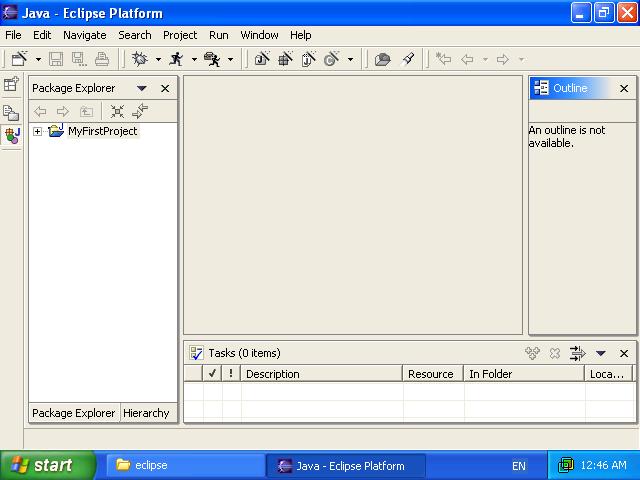
You should now see your new project appear on the left under the "Package Explorer".
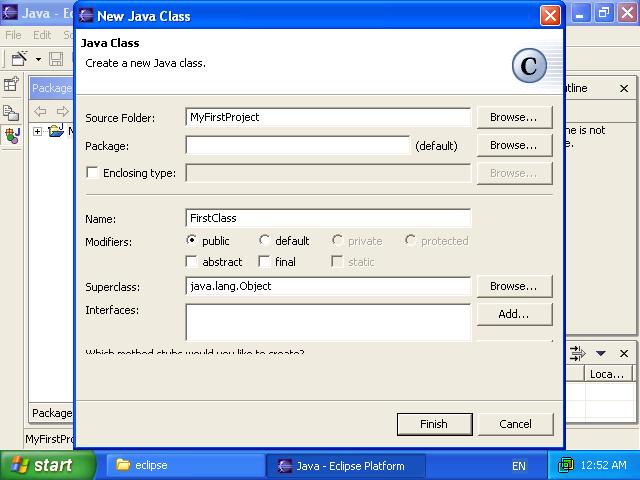
To create a new class go File -> New -> Class. Give the class a name under the "Name:" field, and click finish (note there are also options on the bottom of this window for automaticlly including a main method or constructor methods). Click Finish and let eclipse churn away creating your class. When it has finished, your new class should also appear under the "Package Navigator" and your class will be opened for editing.
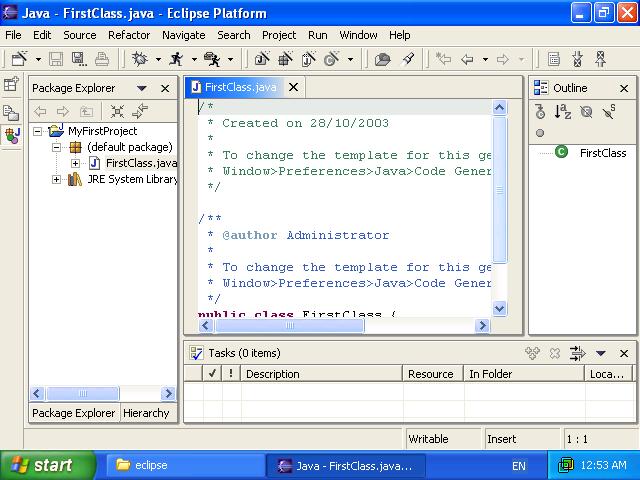
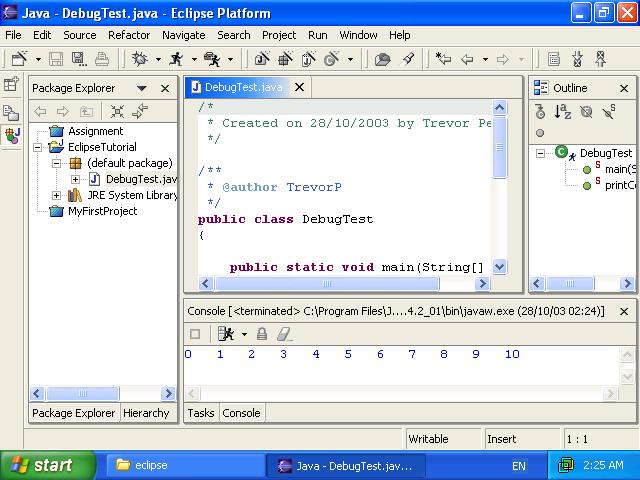
Now its time for a quick introduction to the Eclipse "Java Perspective".
Along the top we see the normal type menus, followed by a toolbar. The First icon is the "new" (![]() ) icon, it can be used to create new projects and classes (rather than going File->New). Next is the "Save" icon which simply saves the current class. It may also be useful to save all classes you are working on. To do this go File -> Save All, or use the shortcut key Ctrl + Shift + S. A little further along is the normal print icon, followed by the two more important icons. The first being the "Debug" icon (the little bug icon) and the "Run" icon (
) icon, it can be used to create new projects and classes (rather than going File->New). Next is the "Save" icon which simply saves the current class. It may also be useful to save all classes you are working on. To do this go File -> Save All, or use the shortcut key Ctrl + Shift + S. A little further along is the normal print icon, followed by the two more important icons. The first being the "Debug" icon (the little bug icon) and the "Run" icon (![]() ), which we will use shortly. Also further on are some forward and backward icons. These can be used to jump back and forward through an open file, to the last part you edited. Experiment with these later, it can make working on a large file (like the ones in the assignment) easier and quicker. Further on are some up and down arrows which can be used for jumping to errors in your files.
), which we will use shortly. Also further on are some forward and backward icons. These can be used to jump back and forward through an open file, to the last part you edited. Experiment with these later, it can make working on a large file (like the ones in the assignment) easier and quicker. Further on are some up and down arrows which can be used for jumping to errors in your files.
Down the left side is are the different "Perspectives". We can use this later to switch between the "Java Perspective" and the "Debug Perspective".
The package explorer lists all projects and their files. It also lists other items, such as packages used, but we need not concern ourselves with these.
The main editing window is where we work on our files. It features tabs at the top to allow multiple open files.
The Outline on the right hand side lists all the methods and variables in a file, by clicking on an item, Eclipse will jump to the section of code where that item is defined. Have a play with this later.
Lastly the bottom section lists all errors and warnings in your code, it also shows TODO items. These can be added by making a comment with "TODO" written in it, for example ![]() You can double click on items in this box to jump to that section of code.
You can double click on items in this box to jump to that section of code.
Completing and Running the Example Program
Here we will learn a few of the coding features of Eclipse.
Add a main method to your program by typing on a new line "public static void main(String[] args)". Press enter to go to the next line, then type "{". You will notice that Eclipse automatically adds a second closing bracket on the next line. Press enter again and notice that Eclipse automatically indents the cursor ready to type another statement.
Next Type "System." and wait for a few seconds. Eclipse will automatically create a list of possible elements to insert into your code. Next type "o" and Eclipse narrows the list of elements down to "out". Select this by pressing enter. Then complete the line by typing ".println("Hello world!")" (leave out the semicolon for demonstration purposes).
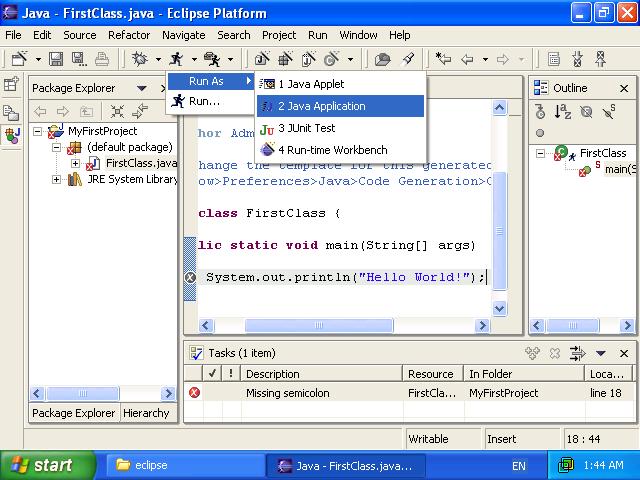
You will notice at this point that Eclipse has underlined the line with a red line, similar to the way word does when there is a spelling error. Eclipse has picked up a Syntax error and underlined it to show us. If we now save the file Eclipse will show an entry in the "Tasks" box at the bottom of the screen. Double clicking this will highlight the error.
Fix our error by adding the semicolon to continue.
To run out new program we use the "Run" icon at the top of the screen, however because Eclipse is designed to allow the design many different types of Java application, we have to tell it which one we are using. Click the down arrow on the right side of the first little running person "Run" icon, choose "Run As" and choose "Java Application".
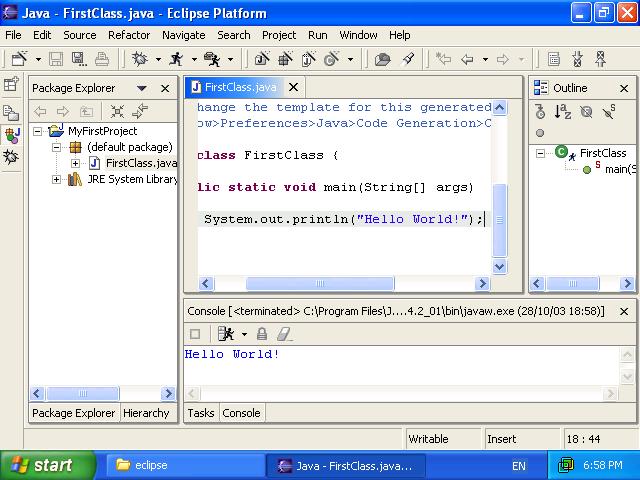
Eclipse will ask us if we want to save our files before running the application. Click the OK button to do so and allow Eclipse to continue. Eclipse will compile and run your program showing the output in the "Console" box at the bottom of the screen.
Eclipse has hidden our "Tasks" view, but we can switch back to that by clicking the new "Tasks" tab right at the bottom of the screen.
Importing and exporting
As we need to complete our java assignment, we need to be able to import out semi-completed project, and then export it again when we are finished for submission.
To import your assignment, first create a new project.
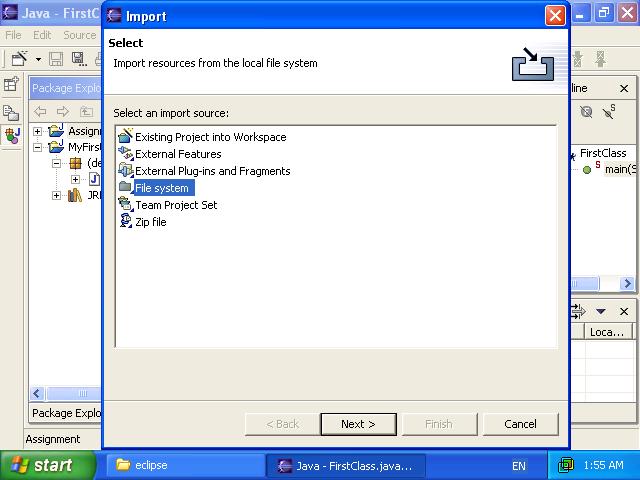
To import files go File -> Import.
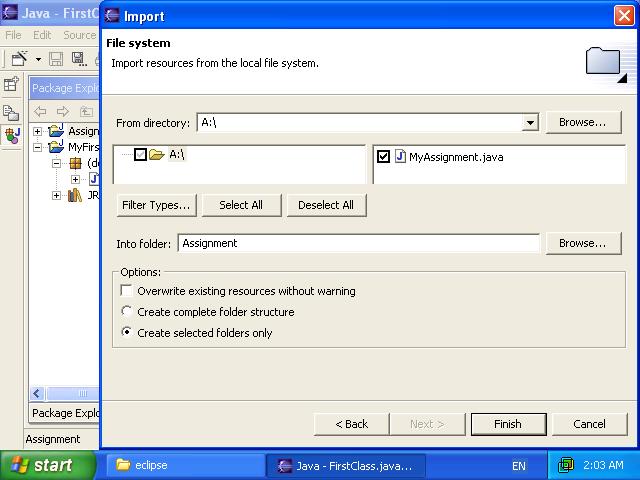
Choose "File System" and click next. Click browse beside the "From Directory:" field and locate your file(s). Select the folder on the left (clicking on the folder, not the checkbox), then choose the files you want to import on the right (ticking the checkboxes). Ensure the correct project is selected in the "Into Folder" field, if it is not, click the Browse box to select the correct project.
Click Finish.
That's all there is to importing. You can drop down the contents of your project in the "Package Explorer" on the left (clicking the little ![]() beside the project, then drop down the "(default package) to see your files. You can double click on the file to edit it.
beside the project, then drop down the "(default package) to see your files. You can double click on the file to edit it.
Exporting follows much the same process. File -> Export, select "File System" click next. Select the project on the left, then the files you want to export (you dont need to export ".classpath" or ".project" files. Select the destination in the "To directory" field, then select finish.
Debugging an Application
Before starting this section you can test your importing skills by downloading and importing this file. Find the imported file in the "Package Explorer" on the left and double click it to edit it.
You should be able to run this file straight away, by selecting the "Run" drop down arrow, choosing "Run as", then "Java Application".
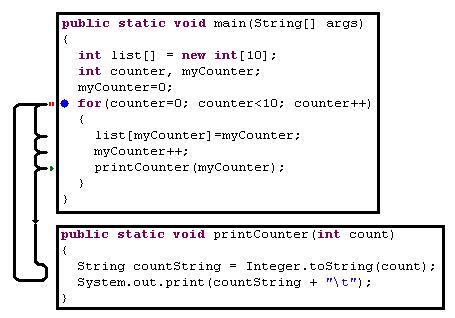
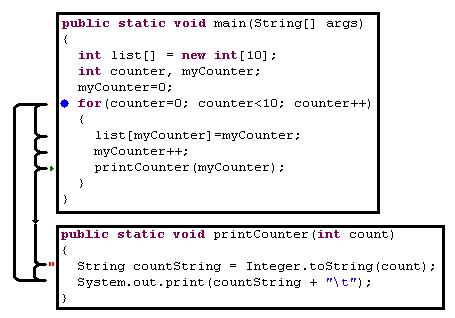
As you can see, this program contains two methods, a main method, and a printCounter method. The main method loops using a for loop, and repeatedly calls printCounter, passing a different number each time. printCounter, simply prints the number followed by a tab character.
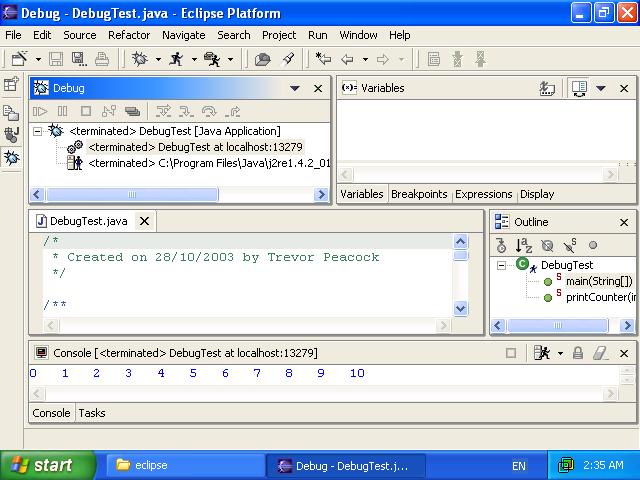
To start debugging, click the drop down arrow to the right of the "Debug Project" icon (the little bug) , choose "Debug As" and choose "Java Application". Eclipse will change to the "Debug Perspective" before running the application.
You will notice a new icon down the left hand side of the screen. This is the "Debug Perspective" icon. You can use these icons (the "Debug Perspective" and "Java Perspective" buttons) to switch between perspectives.
A quick introduction to the features of the "Debug Perspective". The "Debug" view can be seen up the top left. This box shows all previous executions (runs) of the file. Although the contents of this box are a little complicated, we needn't concern ourselves with it. The important bit is the icons at the top, the little play icon, the pause and stop icons, and the arrows to their right. To the right of the Debug view is the "Variables" view. While a program is paused, this view shows all variables in use, and their values. As well as simple variables, it will show the contents of arrays and other complex objects and data types.
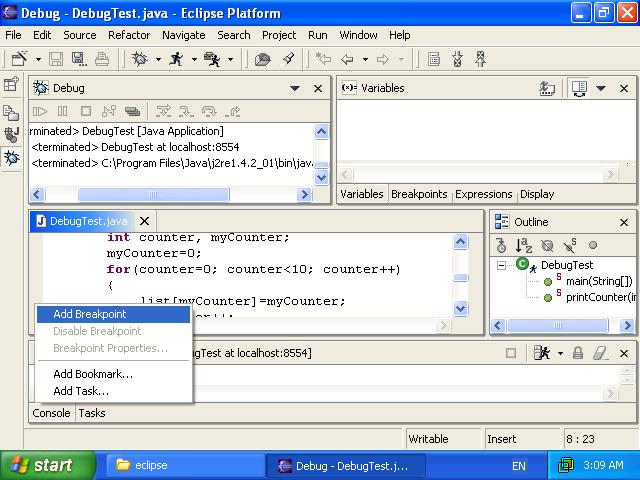
The program ran straight through that time. Lets add a breakpoint to start debugging properly. Find the line "list[myCounter]=myCounter;" and right click on the grey (or possibly blue) bar down the left hand side of the edit view at a point just to the left of that line of code.
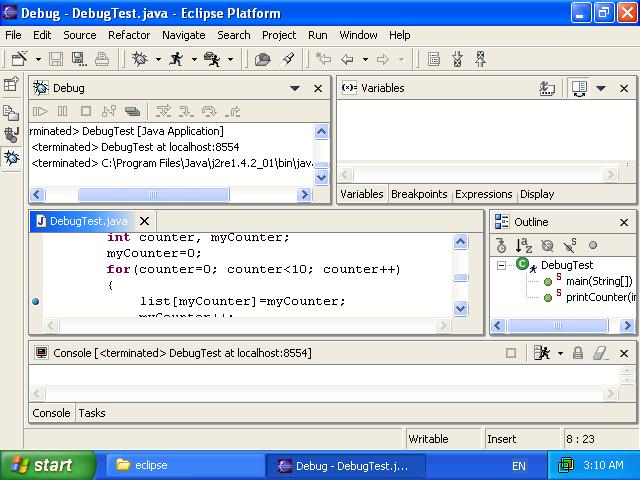
Choose "Add Breakpoint" and a blue dot should appear beside that line.
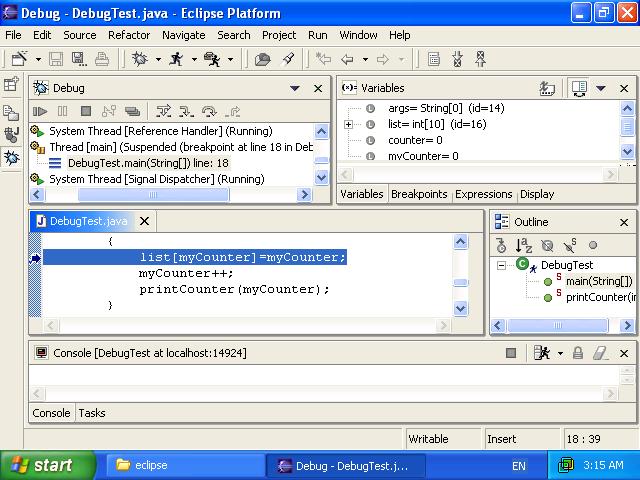
Now start the Debug again (Debug icon -> Debug As -> Java Application). After Eclipse readies itself it will start running the program, but will stop soon after. Eclipse has paused the execution of the program just before it runs the line "list[myCounter]=myCounter;". Eclipse will pause before any line marked with a breakpoint.
You will notice the "Variables" view is now populated with variables defined in the program, args is the parameter passed to main ("public static void main(String[] args)"), list, counter and myCounter are defined in main. It also reports the values of the variables. You can drop down the list item and see all the elements in the array.
Now to play with the debugging features. Click the play button in the "Debug" view (the one next to the pause and stop buttons). This will start the program running, but it will stop again because the program cycles through the loop, then comes back to the same line of code where we placed the breakpoint. You will see however, that some of the items in the "Variables" view are now red. This indicates all variables that have been changed since the last pause. If you drop down the list variable and press the play button again, you will see that it has also highlited the element of the array that has changed.
In the Debug view are three important icons (![]() ). These are the "Step Into", "Step Over", "Step Return". Lets take a moment to explain in theory what these do.
These three buttons will step through the program one line at a time, however each one works a little differently.
). These are the "Step Into", "Step Over", "Step Return". Lets take a moment to explain in theory what these do.
These three buttons will step through the program one line at a time, however each one works a little differently.
The "Step Over" (![]() ) will step through lines in a method, but will not follow sub-methods (although they still run, it doesn't pause within them), it will continue in the one method, until it ends and returns to the calling method.
) will step through lines in a method, but will not follow sub-methods (although they still run, it doesn't pause within them), it will continue in the one method, until it ends and returns to the calling method.
The "Step Into" (![]() ) will step line-by-line, but when it reaches a method, it will jump into that method, and step each line within the sub-method. For example, if you push this a few times Eclipse will reach printCounter, then jump into that method, and step through the lines within it.
) will step line-by-line, but when it reaches a method, it will jump into that method, and step each line within the sub-method. For example, if you push this a few times Eclipse will reach printCounter, then jump into that method, and step through the lines within it.
The "Step Return" (![]() ) will finish running a method, then return to the calling method and then pause.
) will finish running a method, then return to the calling method and then pause.
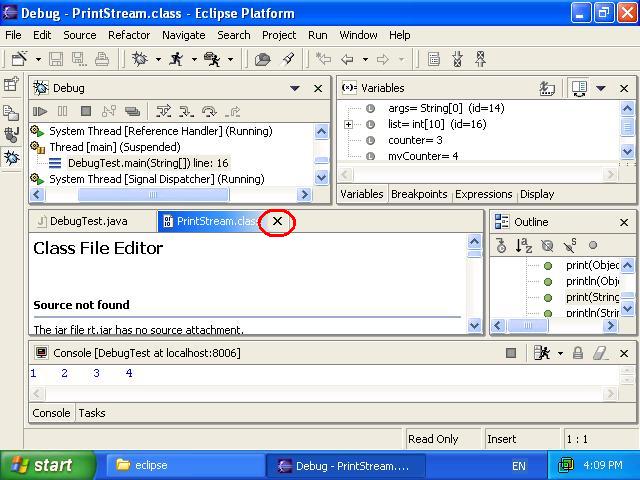
To start using these, press the "Step Over" a few times, and watch what it does. It will cycle the same four lines until the program ends, without following any methods. Keep pressing it until the line "printCounter(myCounter);" is highlited, then press the "Step Into". Eclipse has now contined stepping through the program, but has followed the flow of the program into the printCounter method. Using the "Step Into" only works with methods you have written. It will not work with Java API methods, because we can't see the source code for those. If you do try to do this, Eclipse will show a "Class File Editor - Source Not Found" window.
If this appears you can simply close this window and continue debugging. If your program reaches the end of the program after pressing one of the step buttons, it may show the "Class File Editor - Source Not Found" for "Thread.class". This is the Java built in methods working to close your program. If you see this at the end of your program, simply press the play button to let the program exit normally.
Continue pressing the "Step Over" button. Eclipse will keep stepping through lines, exit the printCounter method, then continue looping round and round in the for loop. Press the "Step Over" button until you reach the "printCounter(myCounter);" line again, then press the "Step Into". Eclipse has now highlighted the first line of the printCounter method again. Now press the "Step Return" button. you will notice that this jumps back into the main method again, into the for loop. What eclipse has done is to finish running the printCounter method, and return back to the main method, highlighting the next line after the printCounter method.
Finishing it off
Now we know how to step through, into and out of methods in your programs. This can make debugging your applications very easy as you can see each step of your program as it runs, while Eclipse constantly shows you the values of your variables.
A Few points to remember:
You can add multiple breakpoints in your program, and just use the "Play" icon to set the program running until it hits the next breakpoint. You can also use the step buttons. Breakpoints can be added and removed while the program is running.
Breakpoints are removed by right-clicking the blue breakpoint dot and selecting "Remove Breakpoint". You can also remove all breakpoints by switching to the "Breakpoints" view (one of the tabs under the "Variables" view), then right-clicking inside the view and selecting "Remove All". The Breakpoints view shows all breakpoints in the program.
Breakpoints can also be Enabled and disabled, so that the breakpoints remain in place, but do not stop the program. You can do this by right clicking on the breakpoint dot beside your source code, or by right clicking the breakpoint in the breakpoints view.
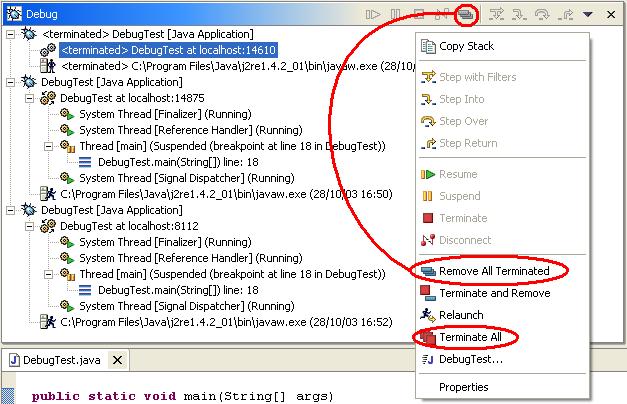
Java allows you to run your program multiple times simultaneously (by hitting the run or debug button, then hitting it again). This can become a little confusing, and can also cause problems because you have multiple copies of your program running taking up processor time and computer memory. If you do end up with this situation, you can right click in the "Debug" view, and choose "Terminate All". This will stop all current instances of your program. You can also use the minus button (![]() ) or right click and select "Remove All Terminated" to clear up the debug box.
) or right click and select "Remove All Terminated" to clear up the debug box.
You can stop your program at any time by pressing the stop button either in the debug view or in the console (output) view.
You can also change variables in the Variables view (right click on variable) while the program is paused. Be careful though, this can interfere with the normal execution of your program.
All queries and comments are welcome. If you have any problems or queries about this tutorial, please email trevorp-itc129@peacocktech.com
Your input is what drives this site.
